Adding Data An Access database is not a file in the same sense as a Microsoft Office Word document or a Microsoft Office PowerPoint are. Instead, an Access database is a collection of objects like tables, forms, reports, queries etc. that must work together for a database to function properly. We have now created two tables with all of the fields and field properties necessary in our database. To view, change, insert, or delete data in a table within Access, you can use the table’s Datasheet View. A datasheet is a simple way to look at your data in rows and columns without any special formatting. Whenever you create a new web table, Access automatically creates two views that you can start using immediately for data entry. A table open in Datasheet View resembles an Excel worksheet, and you can type or paste data into one or more fields. You do not need to explicitly save your data. Access commits your changes to the table when you move the cursor to a new field in the same row, or whe...
Add & Format Charts in Powerpoint 2010
Charts are an effective way of representing data. Long list of confusing numbers can instantly become trends which can be spotted when they are captured as charts. PowerPoint supports addition and formatting of charts.
Given below are the steps to add a chart to PowerPoint.
Step (1): Go to Illustrations group under Insert ribbon

Step (2): Click on the Chart option to open Insert Chart dialog. You can choose the chart category and pick individual chart types from the list.

Step (3): Select the chart type and click OK or double click on the chart type to insert the chart in the slide

Step (4): Along with the chart an Excel spreadsheet is also launched. This spreadsheet is the source for your chart. You can change the category names, series names and individual values to suit your needs.

As you edit the values and the table in Excel the chart gets modified accordingly.
The PowerPoint chart formatting features have been grouped under three ribbons: Design, Layout and Format. The sections below discuss the features under each ribbon. To access these ribbons you must select the chart first.
Chart Design Features
The table below describes various chart design features in PowerPoint.

| Feature | Sub Features | Description |
|---|---|---|
| Type | Change Chart Type | Change the chart type retaining the same data |
| Save As Template | Save current chart type as a template | |
| Data | Switch Row/Column | Transpose current excel data - this is enabled when you have the source data excel sheet open |
| Select Data | Change the data range covered in the chart | |
| Edit Data | Change the chart source data | |
| Refresh Data | Refresh the chart to show the latest data | |
| Chart Layouts | Chart Layouts | Offers list of predefined layouts which can be instantly applied to current chart with a single click |
| Chart Styles | Chart Styles | Offers list of predefined styles which can be instantly applied to current chart with a single click |
Chart Layout Features
The table below describes various chart layout features in PowerPoint.
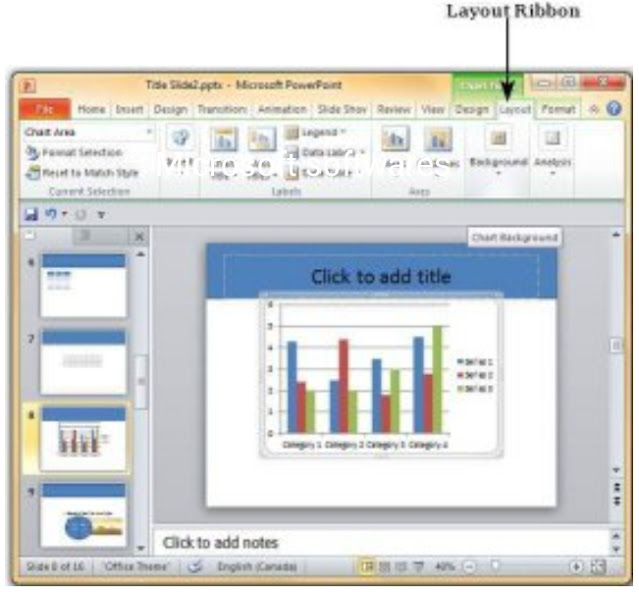
| Feature | Sub Features | Description |
|---|---|---|
| Current Selection | Drop down | Shows the currently selected chart element |
| Format Selection | Shows the selection format dialog to update the selection | |
| Reset to Match Style | Discards all the chart customisations and matches the chart with the overall presentation theme | |
| Insert | Picture | Superimpose an image on top of the chart |
| Shape | Add a shape to the slide | |
| Text Box | Add a text box to the slide | |
| Labels | Chart Title | Define the visibility, position and style of the chart title |
| Axis Titles | Define the visibility, position and style of the axis titles | |
| Legend | Define the visibility and position of the chart legend | |
| Data Labels | Define the visibility and position of the data labels | |
| Data Table | Define the visibility, position and format of the data table | |
| Axes | Axes | Define the position and scale of axes |
| Gridlines | Define the visibility and scale of axes | |
| Background | Plot Area | Toggle chart plot area - available only for 2D charts |
| Chart Wall | Toggle the chart wall - available only for 3D charts | |
| Chart Floor | Toggle the chart floor - available only for 3D charts | |
| 3-D Rotation | Toggle the chart 3D rotation- available only for 3D charts |
Chart Format Features
The table below describes various chart format features in PowerPoint.

| Feature | Sub Features | Description |
|---|---|---|
| Current Selection | Drop down | Shows the currently selected chart element |
| Format Selection | Shows the selection format dialog to update the selection | |
| Reset to Match Style | Discards all the chart customisations and matches the chart with the overall presentation theme | |
| Shape Styles | Shape Fill | Offers different shades to be added to selected chart series item. You can pick from solid shade, texture, image or gradient shading |
| Border | Offers different border options for selected chart series item. You can edit the border color, thickness and style | |
| Effects | Offers the ability add special effects to selected chart series item | |
| Word Art Styles | Text Fill | Allows you to change the color of the text within the chart |
| Text Outline | Allows you to add an outline to the text within the chart and change the outline color, weight and style | |
| Text Effects | Allows you to add special effects (like reflection, shadow etc.) to the text within the chart | |
| Quick Styles | Contains a list of pre-defined Word Art styles that can be applied to the selected text within the chart with a single click | |
| Arrange | Bring Forward | Allows you to move the chart up by one layer or right to the top |
| Send Backward | Allows you to move the chart down by one layer or right to the bottom of the slide | |
| Selection Pane | Toggles the Selection and Visibility sidebar | |
| Align | Allows you to align the entire chart with reference to the slide | |
| Group | Allows you to group multiple charts as one group object, or split a group object into individual charts | |
| Size | Height | Allows you to adjust the chart height |
| Width | Allows you to adjust the chart width |
So nice I am enjoying for that post as for u latest version of this Security tool Available
ReplyDeletemicrosoft office crack